Why Use a Diffusion Index?
Diffusion indexes are a useful way to summarize economic information from surveys because they are easy to understand and correlate well with economic activity over time. To use diffusion indexes most effectively as a measure of change, however, it is important that the extensive margin of the indicator in question explains more of the change in that indicator than the intensive margin. This article, and the papers described in it, can also be used to develop a confidence interval around any diffusion index.
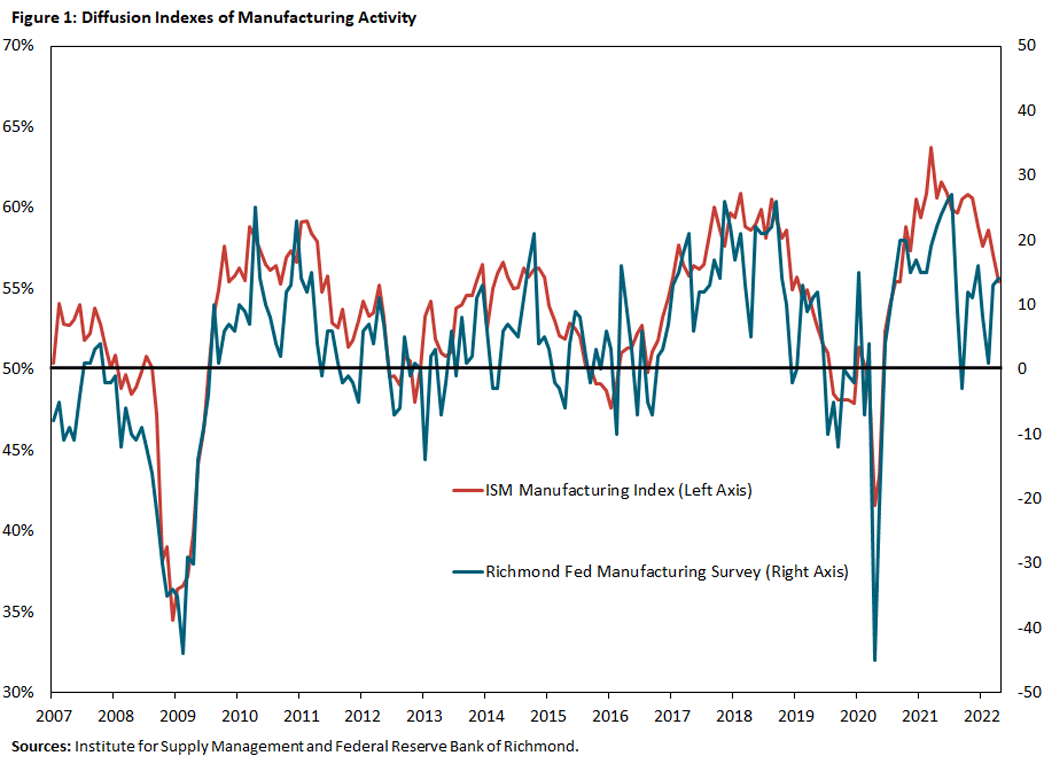
Diffusion indexes are often used to summarize responses to surveys that gauge economic activity. Because surveys of economic actors are often more timely than publicly available data on economic activity, statistics developed from survey responses can be used as real-time sources of information. Diffusion indexes have also been found to correlate well with economic activity over time.
But what exactly is a diffusion index, and how should it be used? How well do diffusion indexes represent economic indicators such as employment or wages? And what level of confidence do we have in the point estimate of a diffusion index?
What Is a Diffusion Index?
A diffusion index is a statistic derived from survey responses. Consider a survey panel where participants answer multiple choice questions about an economic series of interest. For example, in the Richmond Fed monthly business surveys, manufacturing- and service-sector firms are asked to respond to the statement “Compared to the previous month, the number of employees at your firm has…” with “decreased,” “stayed the same” or “increased.”
In this case, the diffusion index is the share of respondents who said that an indicator improved (here, employment increased) minus the share of respondents who said that an indicator deteriorated (here, employment decreased).
For example, out of 132 respondents, 63 reported that employment increased, 25 reported that it decreased, and 44 reported that it stayed the same. Thus, the diffusion index would be 0.29 (63/132 – 25/132). The Richmond Fed then multiplies the reading by 100 and reports the employment diffusion index as 29. A value above 0 is interpreted as an expansion in employment, and a value below 0 is interpreted as a contraction.
While the Richmond Fed’s diffusion index is a common version of a diffusion index, there are variations. For example, the Institute for Supply Management’s diffusion indexes of manufacturing activity add one half of the share of respondents who report no change in conditions to the share that reported an increase. In the example above, the ISM would add 0.5*(44/132) to (63/132) for an index value of 0.64.
How Should a Diffusion Index Be Used?
A diffusion index provides information on the extensive margin of change (the number of firms that reported a change) but not on the intensive margin of change (the amount of that change). In comparison, employment data from the Bureau of Labor Statistics (BLS) reflects changes in both the intensive and extensive margins. For example, a 200,000-job gain reported by the BLS is a net change in employment, reflecting the net employment change at each individual firm (the intensive margin) across all firms (the extensive margin).
The 2020 paper “The Information Content and Statistical Properties of Diffusion Indexes” disaggregates BLS employment change into an intensive and extensive margin and finds that variations in overall employment growth arise primarily from changes in the quasi-extensive margin. In other words, movements in employment tend to reflect the share of firms that reported change more than variations in growth rates among firms.
This indicates that the Richmond Fed employment diffusion index should predict movements in District employment. Indeed, in a 2015 article — “Monitoring Economic Activity in Real Time Using Diffusion Indices: Evidence from the Fifth District,” co-authored with Pierre-Daniel Sarte — we create a synthetic diffusion index from observed BLS employment data on the Fifth District. We find both that the constructed index accounts for the bulk of changes in aggregate employment growth and that the Richmond Fed employment diffusion index (produced using firm-level surveys) closely tracks the synthetic diffusion index. A 2017 paper, “Using the Richmond Fed Manufacturing Survey to Gauge National and Regional Economic Conditions,” corroborates that the Richmond Fed employment diffusion index performs reasonably well at explaining changes not just at the regional level, but also at the national level.
However, survey-based diffusion indexes have a limitation: To be useful, changes in the variable of interest have to be driven more by the extensive margin than the intensive margin. This limitation comes out when using diffusion indexes to measure changes in wages, for example. Because aggregate wage changes are driven more by the intensive margin (the percent change in wages in sectors whose wages are changing in each month) than the extensive margin (the number of sectors/firms whose wages are either increasing or decreasing in a given month), no diffusion index — constructed or survey based — does well in predicting wage changes.
How “Confident” Are Diffusion Indexes?
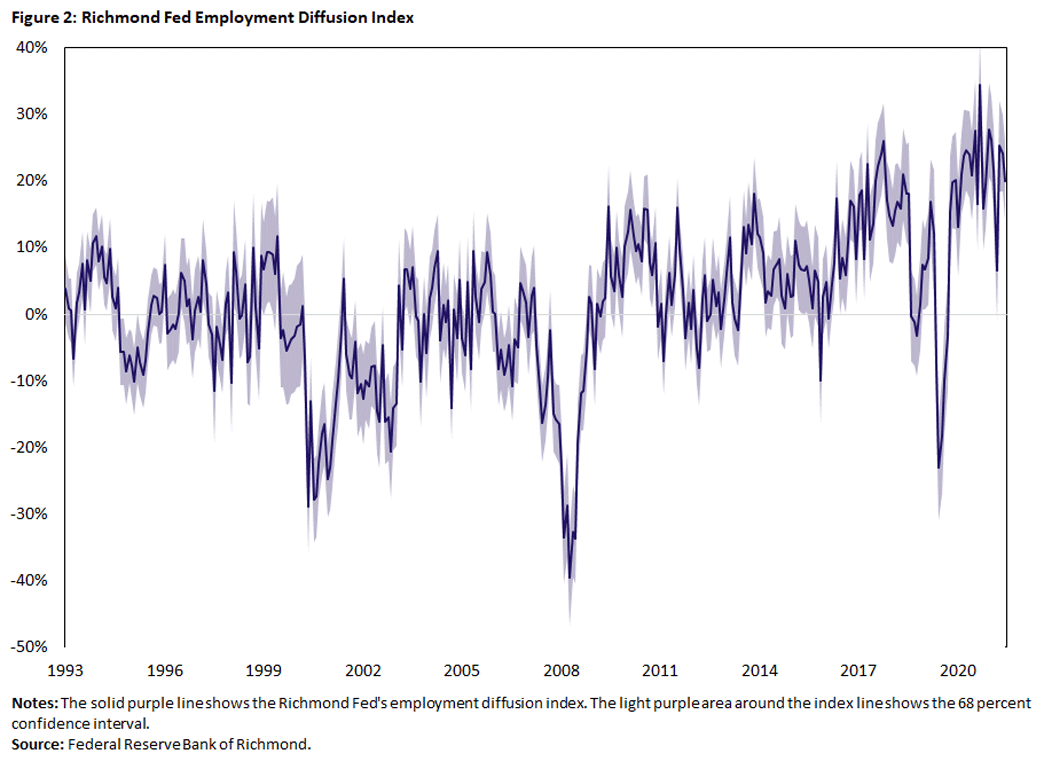
Even when diffusion indexes accurately describe changes in economic variables, it is important to assess statistical confidence. To perform inference analysis based on the diffusion index, we first need to develop a statistical framework. A detailed explanation of this framework is laid out in the aforementioned paper “The Information Content and Statistical Properties of Diffusion Indexes” and is summarized in our appendix .
.
Using these results, we can calculate confidence intervals shown below for the Richmond Fed employment diffusion indexes.
How Else Could We Use a Diffusion Index?
Imagine if exactly half of survey respondents reported that employment increased from last month and the other half reported that employment decreased. This would provide a diffusion index of zero, which is the same value that would result from all respondents reporting that activity is the same as last month.
However, the former result would indicate a much more uncertain economy for firms than the latter, and we know that uncertainty can weigh on economic activity. Here, we can use the variance around a diffusion index as a measure of uncertainty, since it would be higher in the former example. In other words, the standard error of the diffusion index can be used as a measure of uncertainty in the economy.
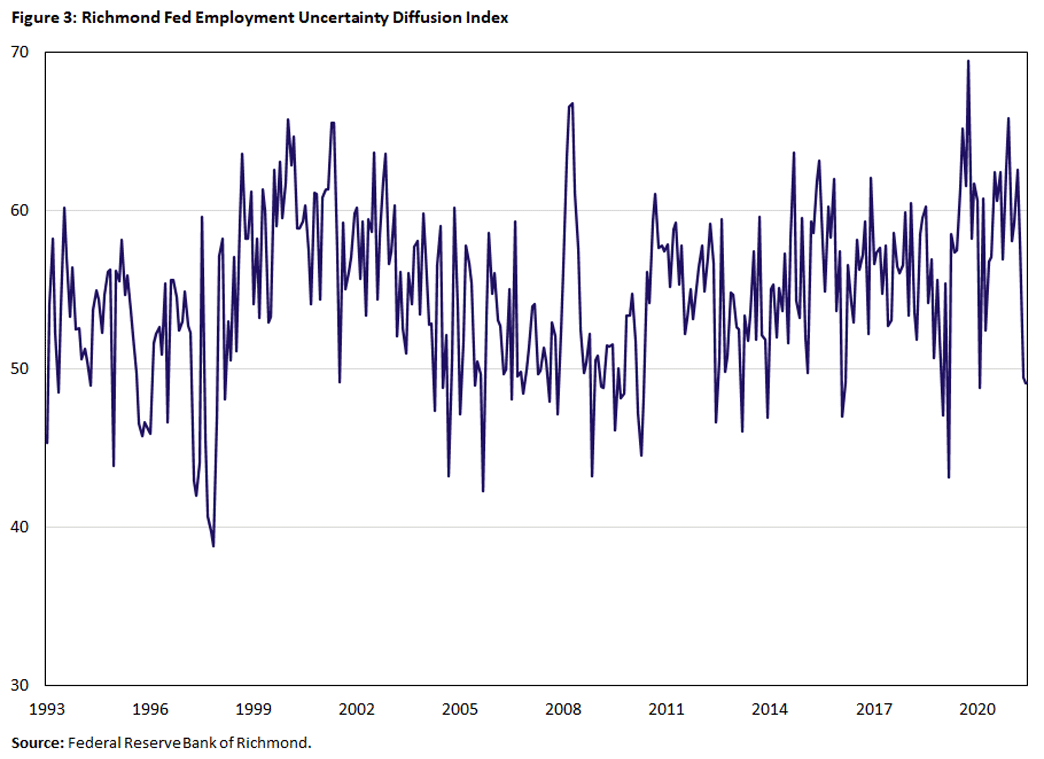
In principle, we might expect a negative correlation between the diffusion index and its (normalized) standard deviation. However, the correlation between the diffusion index and its standard deviation is remarkably low for the period under consideration. (It is in fact positive for employment.) In the end, the uncertainty indicator might be providing information on other economic realities.
Combining Indicators Into Composite Diffusion Indexes
Several agencies and organizations — including the Richmond Fed and the ISM — construct and report weighted averages of several individual diffusion indexes that each track indicators of economic activity. These are called composite diffusion indexes. The following are two examples:
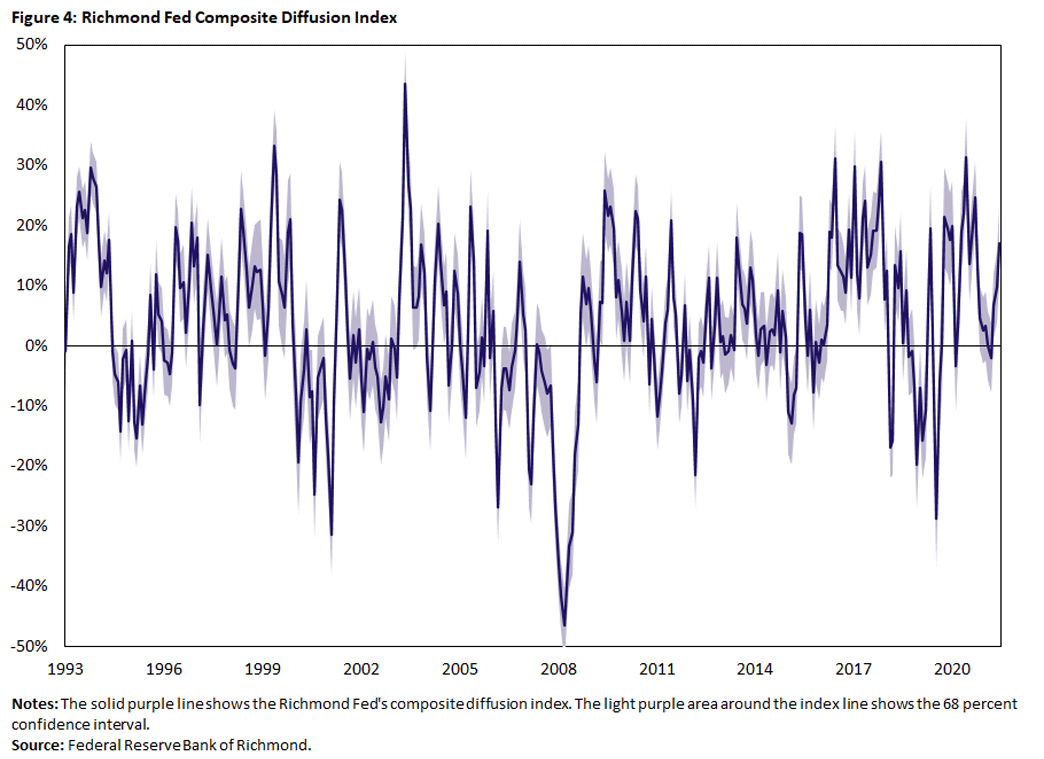
- The Richmond Fed manufacturing composite index combines the employment, shipments and new orders indexes.
- The ISM composite index equally weights five individual diffusion indexes: employment, shipments, orders, production and inventories.
The aforementioned paper “Using the Richmond Fed Manufacturing Survey to Gauge National and Regional Economic Conditions” finds that the Richmond Fed composite diffusion index explains the national and regional economy reasonably well. The paper emphasizes, however, that different weights should be used for composite indexes that track the performance of the national economy versus the regional economy.
The paper concludes that it is possible to improve the predictive power of a composite index by:
- Using a model that accounts for a richer dynamic structure
- Carefully choosing the weights attached to the individual diffusion indexes
- Incorporating other readily available survey questions1
The Upshot on Using Diffusion Indexes
Diffusion indexes offer many advantages over other statistical representations of survey data. They are succinct, easy to understand and correlate well with economic activity. They cannot be used for all economic indicators, but they can be very useful for those measures where the extensive margin drives more of the change than the intensive margin. The variance in the diffusion index can also be used to better understand uncertainty in an economy.
Santiago Pinto is a senior economist and policy advisor and Sonya Ravindranath Waddell is a vice president and economist in the Research Department at the Federal Reserve Bank of Richmond.
1For more information on the statistical properties of composite diffusion indexes and how to calculate variances, see the 2020 paper “The Information Content and Statistical Properties of Diffusion Indexes.”
To cite this Economic Brief, please use the following format: Pinto, Santiago; and Waddell, Sonya Ravindranath. (June 2022) “Why Use a Diffusion Index?” Federal Reserve Bank of Richmond Economic Brief, No. 22-22.
This article may be photocopied or reprinted in its entirety. Please credit the authors, source, and the Federal Reserve Bank of Richmond and include the italicized statement below.
Views expressed in this article are those of the authors and not necessarily those of the Federal Reserve Bank of Richmond or the Federal Reserve System.