The New York Fed DSGE Model Forecast—June 2022
The New York Fed DSGE Model Forecast—June 2022
This post presents an update of the economic forecasts generated by the Federal Reserve Bank of New York’s dynamic stochastic general equilibrium (DSGE) model. We describe very briefly our forecast and its change since March 2022.
As usual, we wish to remind our readers that the DSGE model forecast is not an official New York Fed forecast, but only an input to the Research staff’s overall forecasting process. For more information about the model and variables discussed here, see our DSGE model Q & A.
The New York Fed model forecasts use data released through 2022:Q1, augmented for 2022:Q2 with the median forecasts for real GDP growth and core PCE inflation from the May release of the Philadelphia Fed’s Survey of Professional Forecasters (SPF), as well as the yields on 10-year Treasury securities and Baa corporate bonds based on 2022:Q2 averages up to May 27. In addition, for 2021:Q4 and each subsequent quarter, the expected federal funds rate between one and six quarters into the future is restricted to equal the corresponding median point forecast from the latest available Survey of Primary Dealers (SPD) in that quarter. For the current projection, this is the May 2022 SPD.
The model’s outlook is considerably more pessimistic than it was in March. It projects inflation to remain elevated in 2022 at 3.8 percent, up a full percentage point relative to March, and to decline only gradually toward 2 percent thereafter (2.5 and 2.1 percent in 2023 and 2024, respectively). This disinflation path is accompanied by a not-so-soft landing: the model predicts modestly negative GDP growth in both 2022 (-0.6 percent versus 0.9 percent in March) and 2023 (-0.5 percent versus 1.2 percent). According to the model, the probability of a soft landing—defined as four-quarter GDP growth staying positive over the next ten quarters—is only about 10 percent. Conversely, the chances of a hard landing—defined to include at least one quarter in the next ten in which four-quarter GDP growth dips below -1 percent, as occurred during the 1990 recession—are about 80 percent.
Changes in the near-term forecasts for GDP growth and core PCE inflation relative to March reflect two factors. The first is a continuation of the cost-push shocks that have hit the economy since early 2021, resulting in a higher projection for inflation and a somewhat lower projection for output growth. The second factor is tighter monetary policy in 2022 and 2023, with the federal funds rate following a much steeper path over the next year and a half than the one projected in March. This expected path for the policy rate is determined by a version of average inflation targeting (AIT), augmented with anticipated policy shocks and informed by expectations from the Survey of Primary Dealers (SPD), as described above. This tighter policy path compared to March is a drag on real activity over the next few quarters, but it has a limited effect on the projected course of inflation due to the flatness of the model’s estimated Phillips curve.
The real federal funds rate implied by these forecasts quickly approaches the natural rate of interest, which is around 1 percent, reaching it in 2023 and modestly overshooting it for the rest of the forecast horizon. Partly reflecting the tighter path of policy, the output gap turns negative in the medium term, declining from 0 percent at the end of 2022 to -1.7 percent in 2023 and -2.6 percent in 2024.
| 2022 | 2023 | 2024 | 2025 | |||||
|---|---|---|---|---|---|---|---|---|
| Jun | Mar | Jun | Mar | Jun | Mar | Jun | Mar | |
| GDP growth (Q4/Q4) |
-0.6 (-3.6, 2.3) |
0.9 (-0.8, 2.6) |
-0.5 (-5.0, 4.0) |
1.2 (-0.6, 3.1) |
0.4 (-4.4, 5.3) |
1.5 (-0.3, 3.4) |
1.4 (-3.9, 6.5) |
1.8 (-0.1, 3.6) |
| Core PCE inflation (Q4/Q4) |
3.8 (3.3, 4.4) |
2.8 (2.1, 3.6) |
2.5 (1.7, 3.4) |
2.2 (1.3, 3.1) |
2.1 (1.2, 3.1) |
2.0 (1.1, 3.0) |
2.0 (1.0, 3.0) |
2.0 (1.0, 3.0) |
| Real natural rate of interest (Q4) |
0.9 (-0.4, 2.1) |
0.0 (-1.3, 1.4) |
0.9 (-0.5, 2.4) |
0.4 (-1.1, 1.9) |
0.9 (-0.7, 2.4) |
0.6 (-1.0, 2.1) |
0.8 (-0.9, 2.5) |
0.6 (-1.1, 2.3) |
Notes: This table lists the forecasts of output growth, core PCE inflation, and the real natural rate of interest from the June 2022 and March 2022 forecasts. The numbers outside parentheses are the mean forecasts, and the numbers in parentheses are the 68 percent bands.
Forecasts of Output Growth
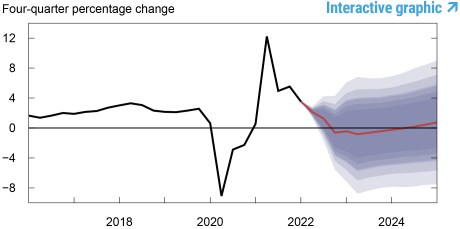

Notes: These two panels depict output growth. In the top panel, the black line indicates actual data and the red line shows the model forecasts. The shaded areas mark the uncertainty associated with our forecasts at 50, 60, 70, 80, and 90 percent probability intervals. In the bottom panel, the blue line shows the current forecast (quarter-to-quarter, annualized), and the gray line shows the March 2022 forecast.
Forecasts of Inflation
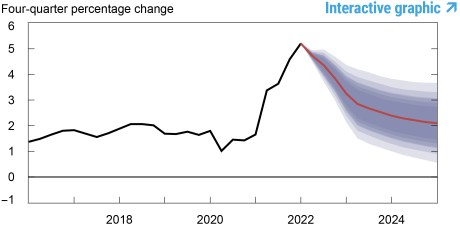
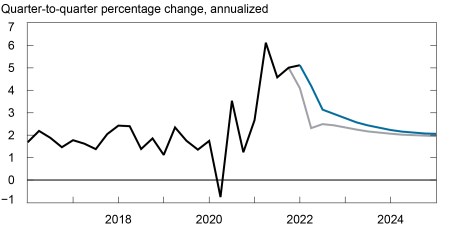
Notes: These two panels depict core personal consumption expenditures (PCE) inflation. In the top panel, the black line indicates actual data and the red line shows the model forecasts. The shaded areas mark the uncertainty associated with our forecasts at 50, 60, 70, 80, and 90 percent probability intervals. In the bottom panel, the blue line shows the current forecast (quarter-to-quarter, annualized), and the gray line shows the March 2022 forecast.
Real Natural Rate of Interest
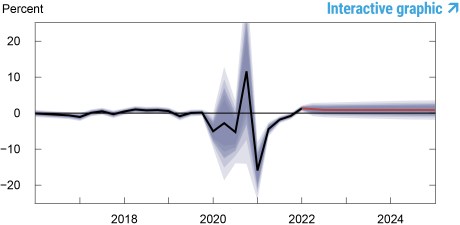
Notes: The black line shows the model’s mean estimate of the real natural rate of interest; the red line shows the model forecast of the real natural rate. The shaded area marks the uncertainty associated with the forecasts at 50, 60, 70, 80, and 90 percent probability intervals.
Marco Del Negro, Aidan Gleich, Shlok Goyal, Alissa Johnson, and Andrea Tambalotti, “The New York Fed DSGE Model Forecast—June 2022,” Federal Reserve Bank of New York Liberty Street Economics, June 17, 2022, https://libertystreeteconomics.newyorkfed.org/2022/06/the-new-york-fed-dsge-model-forecast-june-2022/.
Disclaimer
The views expressed in this post are those of the author(s) and do not necessarily reflect the position of the Federal Reserve Bank of New York or the Federal Reserve System. Any errors or omissions are the responsibility of the author(s).